Chief financial officer's report
Introduction
Clicks Group delivered another resilient performance in tough retail trading conditions, highlighted by robust health and beauty sales, increased margins, strong cash flows and enhanced returns to shareholders.
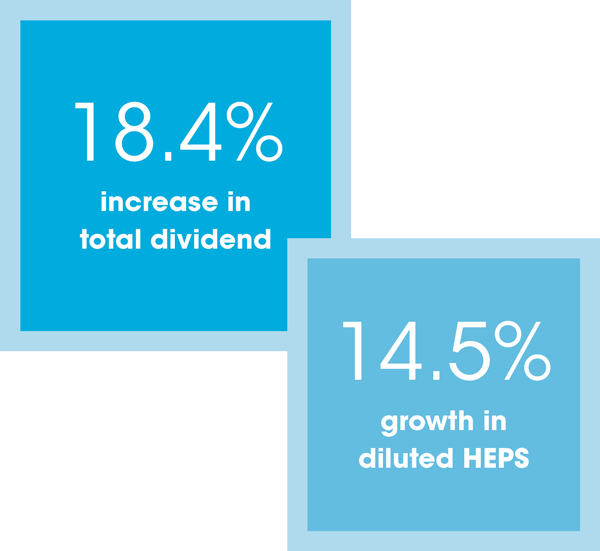
Diluted headline earnings per share (HEPS) grew by 14.5% to 502.1 cents and the total dividend was increased by 18.4% to 322.0 cents per share. The group delivered a total shareholder return of 25.2%, based on dividends paid and the growth in the share price over the year.
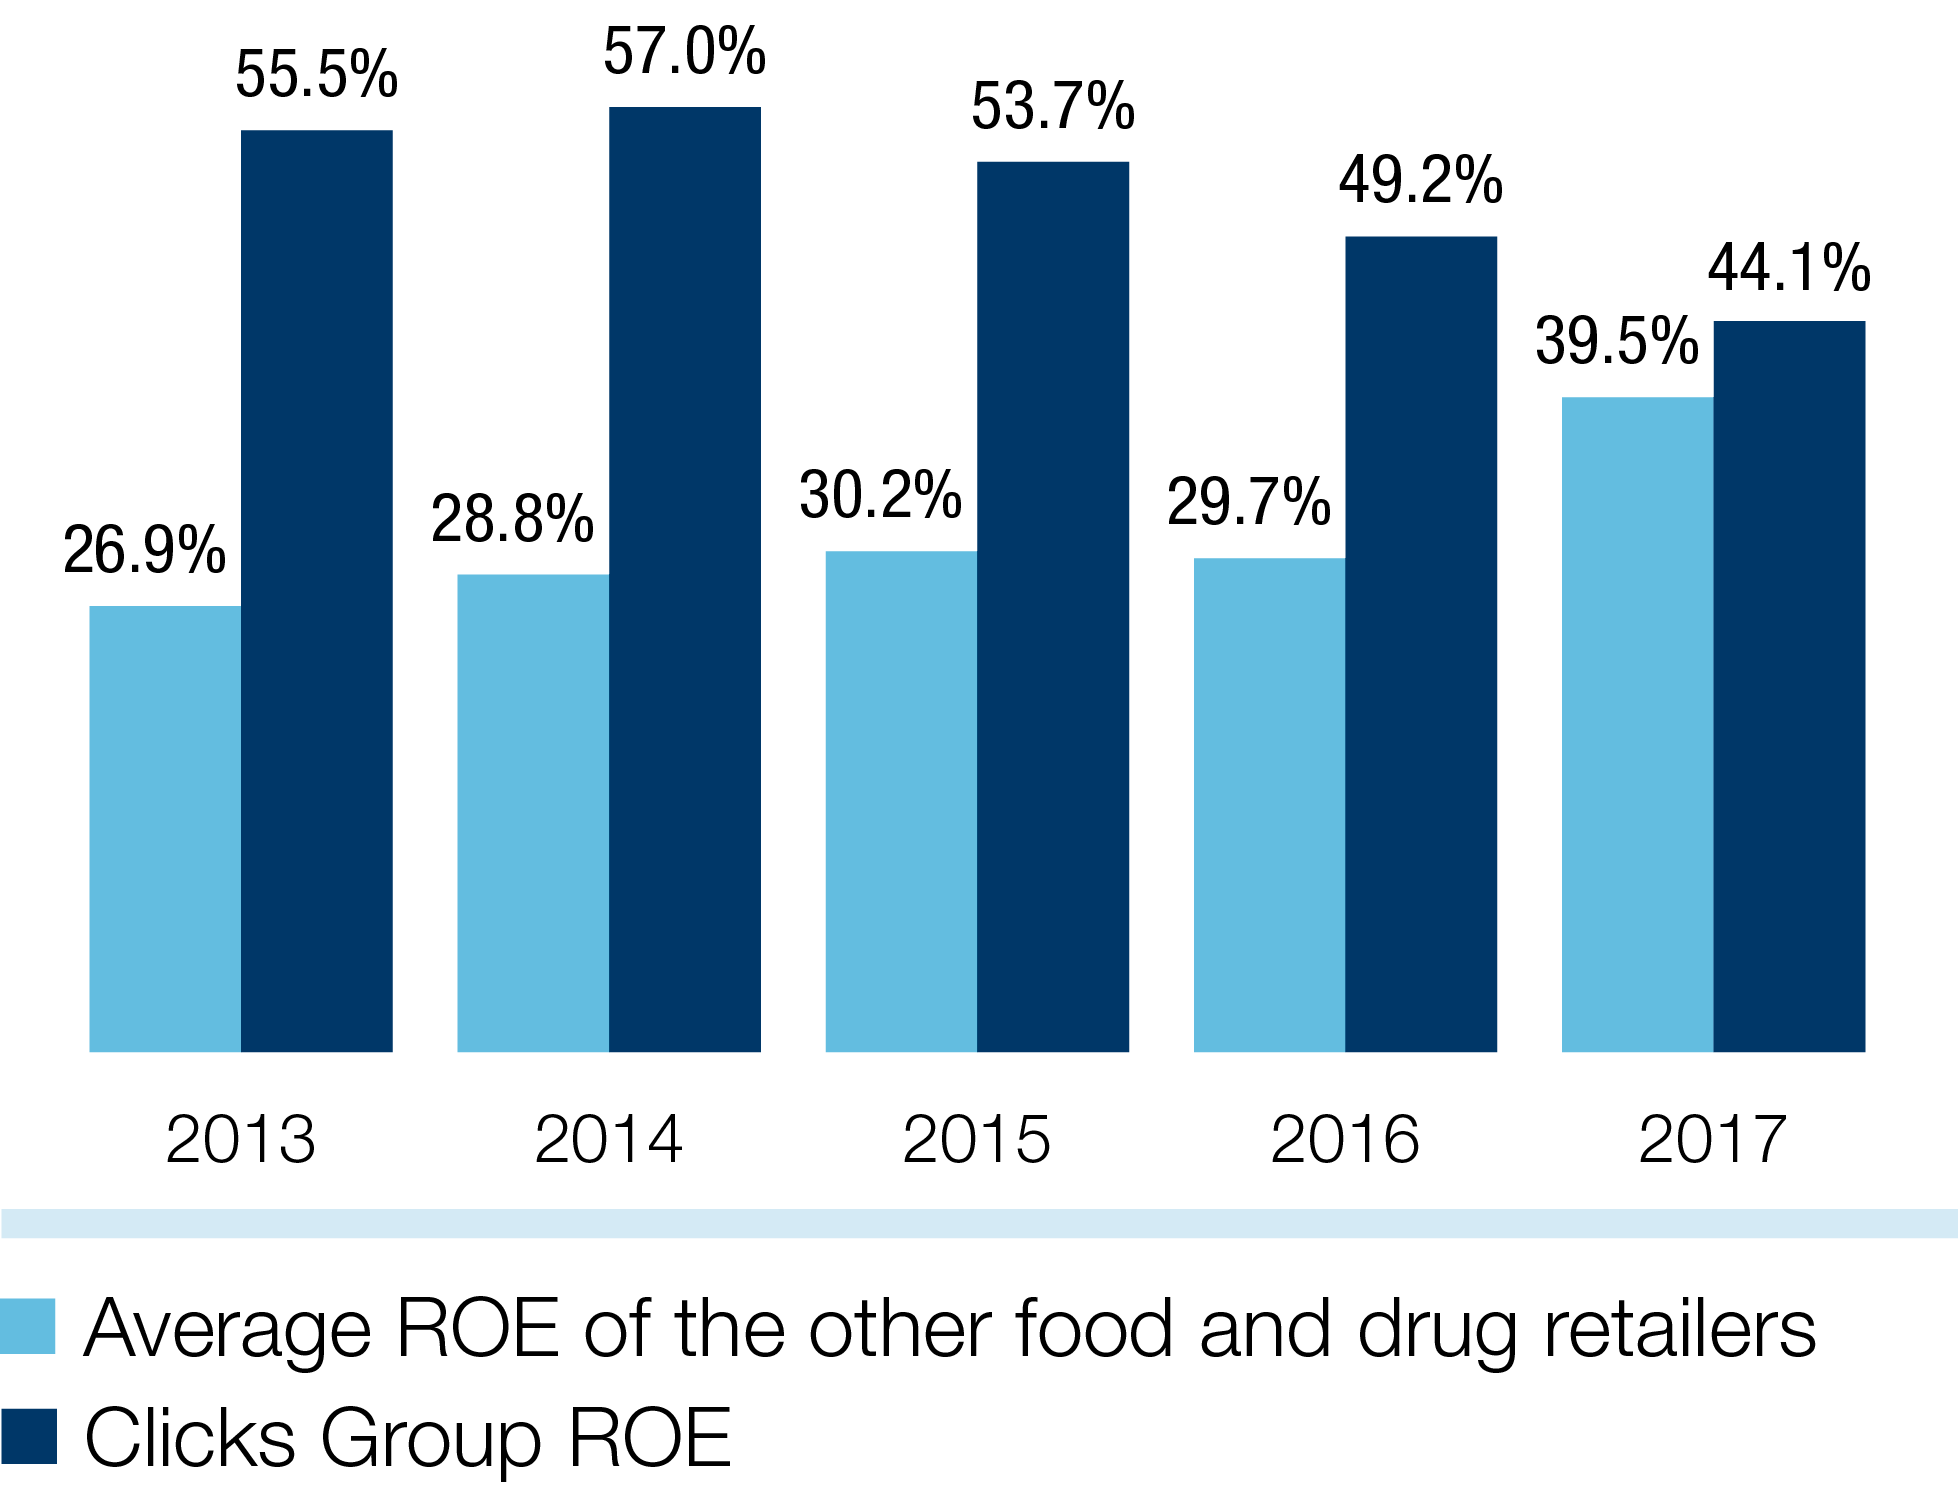
The group’s performance is within the range of all its medium-term financial targets, apart from the return on equity (ROE) which at 44.1% remains among the highest in the retail sector. In the short term the group’s ROE is being impacted by the broad-based employee share ownership programme.
The group’s medium-term financial targets rank in the upper quartile relative to comparable global health and beauty retailers such as Walgreens Boots Alliance (USA), CVS (USA), Raia Drogasil (Brazil), Rite Aid (USA) and Celesio (Germany).
Financial performance
The following review of the group’s financial performance for the year ended 31 August 2017 focuses on the key line items of the statements of comprehensive income and financial position which management considers material to the group’s performance.
The following review should be considered together with the annual financial statements as well as the summary statements of comprehensive income and financial position, and the five-year analysis of financial performance.
Statement of comprehensive income
Turnover
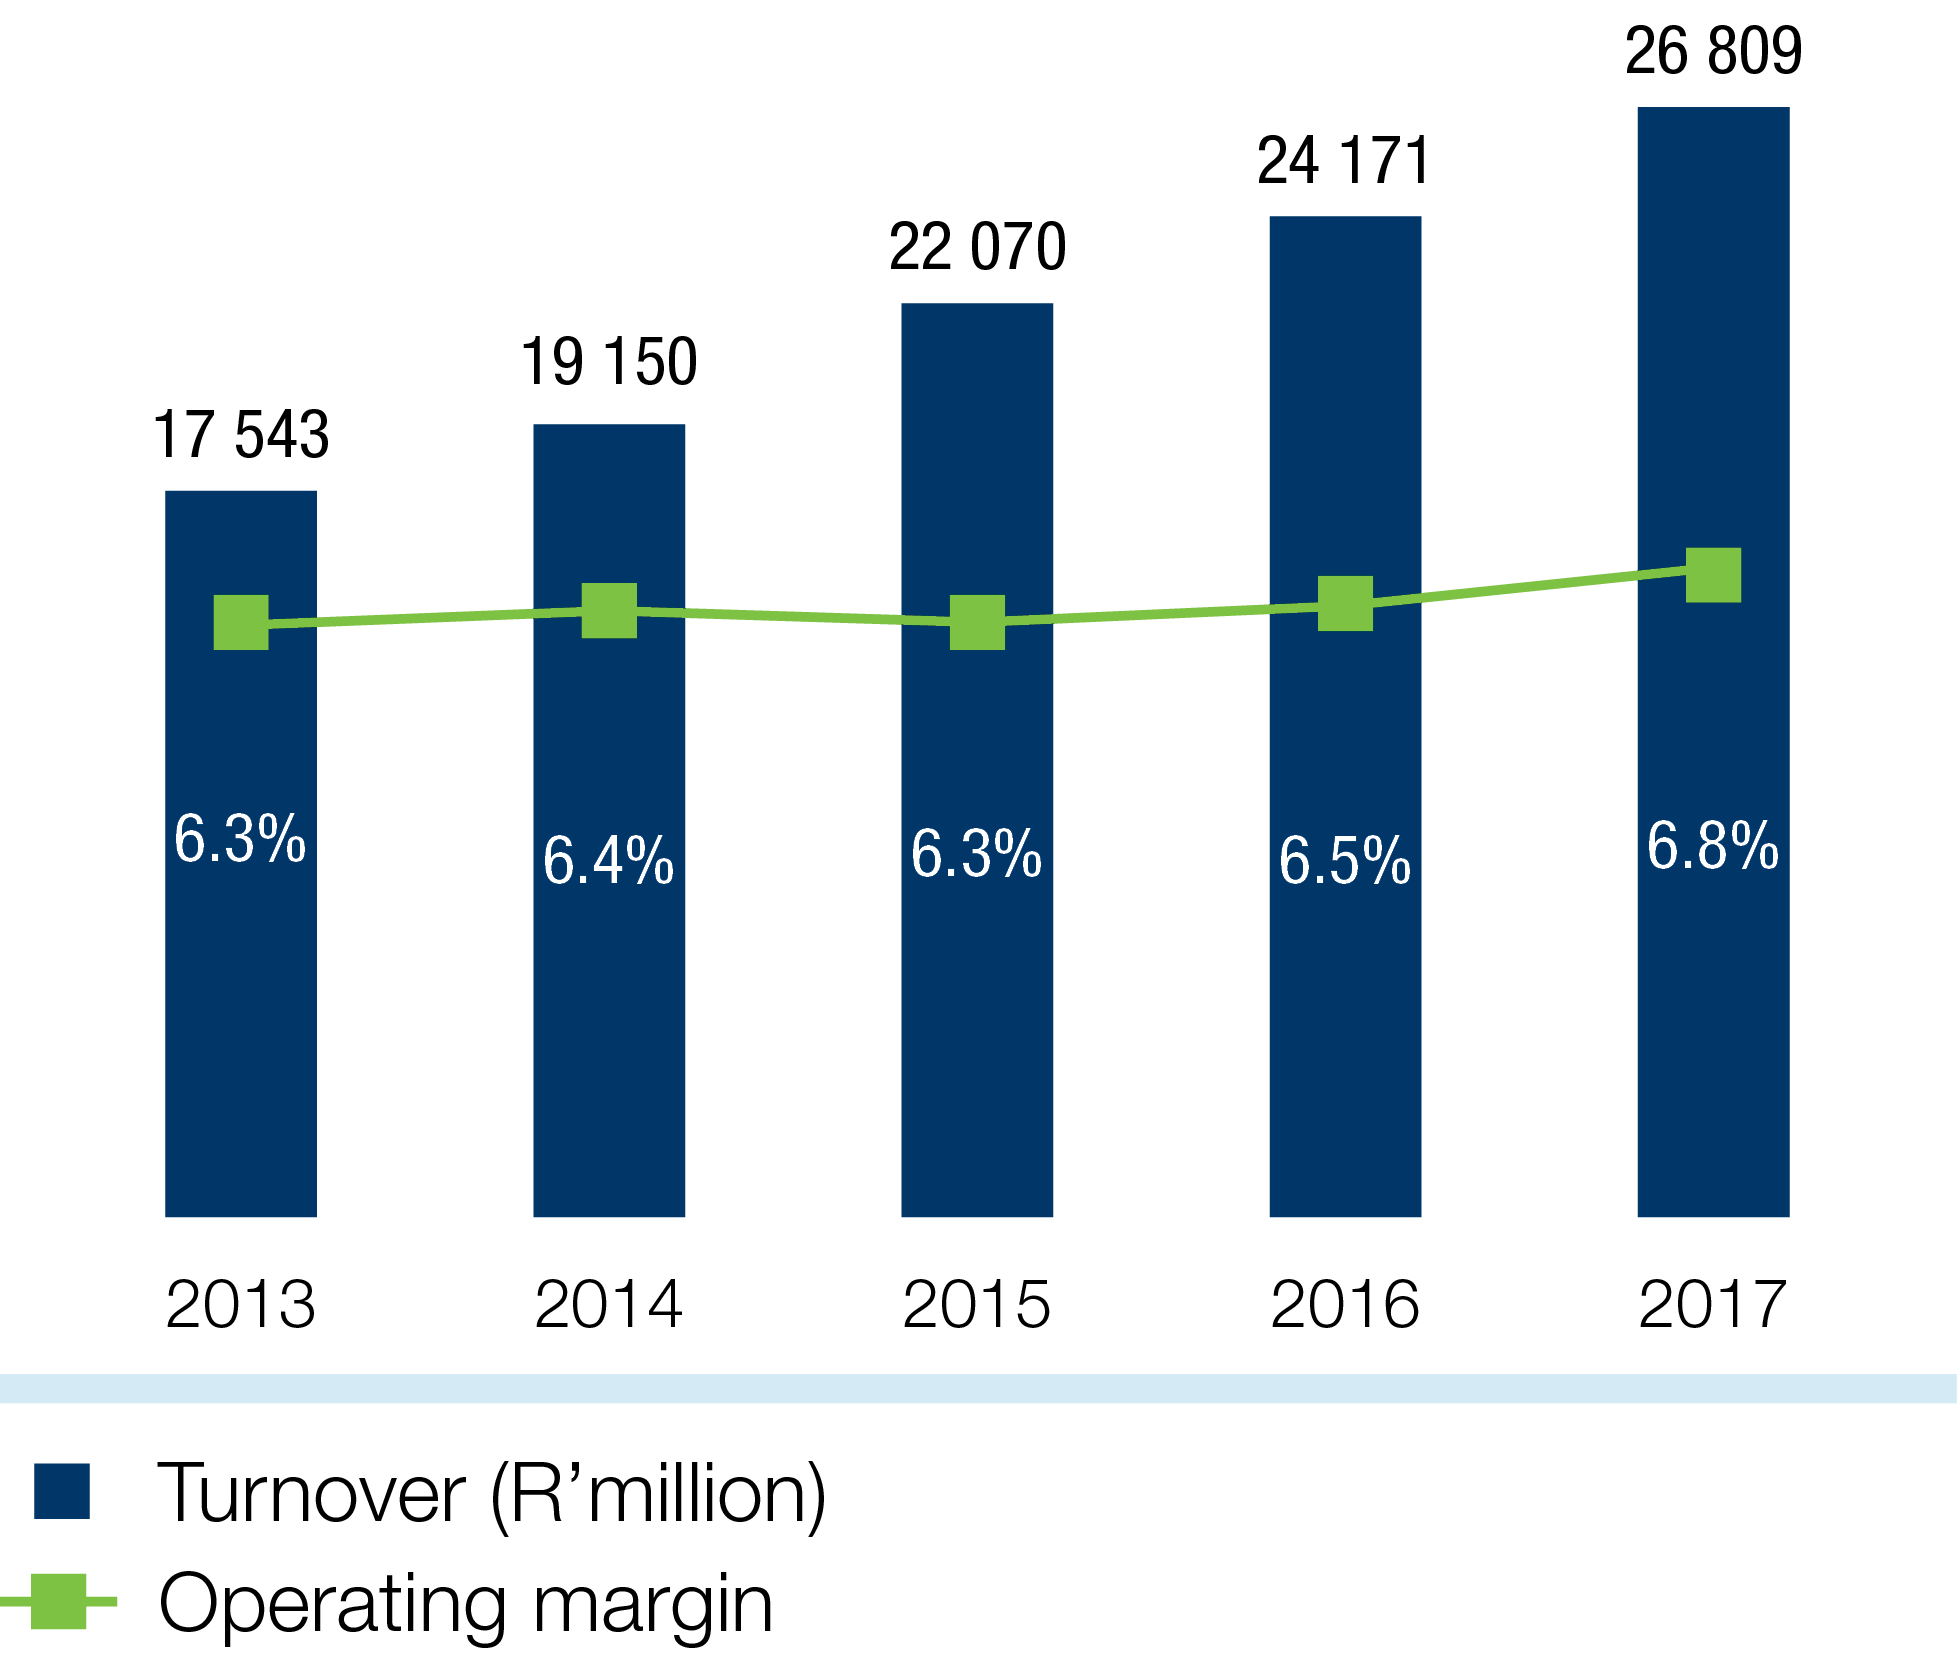
Group turnover increased by 10.9% to R26.8 billion (2016: R24.2 billion) with selling price inflation averaging 5.3% for the year.
Turnover was again consistent for both halves. There is generally minimal seasonal effect on the group’s turnover as the festive season in the first half of the financial year is counter-balanced by the winter season, which is the peak trading period for the health and wellness business.
Retail turnover, including Clicks, The Body Shop, GNC, Claire’s and Musica, increased by 13.5%. Retail selling price inflation averaged 4.9% for the year. Comparable stores sales grew by 8.0%, with strong promotional activity driving real volume growth of 3.1%.
Within the retail division, health and beauty sales increased by 14.7%, while Musica, sales were 7.0% lower owing to the pressure on discretionary consumer spending and a weak schedule of new music and movie releases.
Retail trading space growth accounted for 5.5% of the turnover growth with the net opening of 106 stores which includes the 37 Medicross pharmacies and 43 Netcare front shops.
Distribution turnover grew by 11.4%, benefiting from the single exit price (SEP) increases granted in November 2016 and March 2017, as well as the good growth in the wholesale business.
The trading performance of Clicks and UPD is covered in the operational review.
Total income
Total income grew by 12.2% to R7.1 billion.
The retail total income margin was 20 basis points lower at 33.5% owing mainly to the investment in everyday competitive pricing, supported by effective promotional activity and the faster growth in pharmacy following the integration of the Medicross pharmacies.
UPD’s total income margin was also 20 basis points lower at 7.6%, reflecting the slower year in UPD’s distribution agency business.
Owing to the favourable mix impact from the faster growth in retail, the group’s total income margin strengthened by 40 basis points to 26.7%.
Operating expenditure
Retail expense growth of 12.8% was contained below sales growth despite the investment in new stores and pharmacies. Total leased space increased by 8.2% and over 600 new retail jobs were created. Comparable retail costs increased by 6.3%.
Retail operating expenditure as a percentage of turnover improved to 25.7% from 25.8% in the prior year.
UPD again demonstrated excellent cost control with expenses up only 2.7%, with further improvements in employee productivity and utilisation of the transport fleet.
The group’s operating expenses increased by 11.2%.
Operating profit
Operating profit increased by 15.4% to R1.8 billion (2016: R1.6 billion) as the retail and distribution businesses achieved operating leverage and both expanded margins.
In the retail division, where margin grew by 10 basis points, Clicks and The Body Shop showed strong growth in operating profit which was partially off-set by a reduction of R28 million in Musica’s profit. UPD’s operating margin increased by 20 basis points because of good sales growth, the benefit of two SEP increases and excellent cost control.
The group margin strengthened by 30 basis points to 6.8%.
turnover and margin
return on equity (roe)
Summary statement of comprehensive income
| R’million |
2017 |
% of
turnover |
2016 |
% of
turnover |
%
change |
| Turnover |
26 809 |
|
24 171 |
|
10.9 |
| Retail |
18 893 |
70.5 |
16 640 |
68.8 |
13.5 |
| Distribution |
12 321 |
29.5 |
11 055 |
31.2 |
11.4 |
| Intragroup |
(4 405) |
|
(3 524) |
|
25.0 |
|
|
|
|
|
|
| Total income |
7 147 |
26.7 |
6 368 |
26.3 |
12.2 |
| Operating expenses |
(5 333) |
19.9 |
(4 796) |
19.8 |
11.2 |
| Retail |
(4 850) |
|
(4 298) |
|
12.8 |
| Distribution |
(607) |
|
(591) |
|
2.7 |
| Intragroup |
124 |
|
93 |
|
33.3 |
|
|
|
|
|
|
| Operating profit |
1 814 |
6.8 |
1 572 |
6.5 |
15.4 |
| Retail |
1 485 |
7.9 |
1 306 |
7.8 |
13.7 |
| Distribution |
330 |
2.7 |
276 |
2.5 |
19.6 |
| Intragroup |
(1) |
|
(10) |
|
|
| Loss on disposal of property, plant and equipment |
(5) |
|
(6) |
|
|
| Net financing costs |
(37) |
|
(53) |
|
(29.4) |
| Share of profit of an associate |
3 |
|
2 |
|
|
| Income tax |
(497) |
|
(421) |
|
18.0 |
| Profit for the year |
1 278 |
|
1 094 |
|
16.8 |
Summary statement of financial position
| R’million |
2017 |
2016 |
%
change |
| Non-current assets |
2 854 |
2 507 |
13.8 |
| Property, plant and equipment |
1 534 |
1 345 |
14.0 |
| Other non-current assets |
1 320 |
1 162 |
13.6 |
| Current assets |
6 867 |
5 870 |
17.0 |
| Inventories |
3 754 |
3 479 |
7.9 |
| Trade and other receivables |
2 213 |
2 013 |
9.9 |
| Other current assets |
900 |
378 |
138.0 |
|
|
|
|
| Total assets |
9 721 |
8 377 |
16.0 |
|
|
|
|
| Equity |
3 300 |
2 452 |
34.6 |
| Non-current liabilities |
402 |
406 |
(0.8) |
| Current liabilities |
6 019 |
5 519 |
9.0 |
| Trade and other payables |
5 475 |
5 148 |
6.3 |
| Other current liabilities |
544 |
371 |
46.6 |
|
|
|
|
| Total equity and liabilities |
9 721 |
8 377 |
16.0 |
Statement of financial position
The ratio of shareholders’ interest to total assets increased to 34.0% (2016: 29.3%) and the average gearing level during the year was 14.8% (2016: 23.9%).
The ratio of current assets to current liabilities at year-end was consistent at 1.1 times (2016: 1.1 times), indicating that working capital remains adequately funded.
The group continues to hedge direct exposures to foreign exchange rate fluctuations which impact approximately between 7% and 8% of the cost of sales in the retail business. In addition, the group hedged elements of the long-term incentive scheme for the 2017 to 2019 period. Further detail on the respective hedges and risk management is contained in note 16 in the annual financial statements on the group’s website.
Inventory
Inventory was tightly managed and group inventory days improved from 66 to 65 days. Inventory levels were 7.9% higher, well below the rate of sales growth.
Trade and other receivables
Trade receivables at 40 days (2016: 43 days) continued to be well managed and relate primarily to the UPD business.
Cash and capital management
Cash generated by operations increased by R207 million to R2.0 billion.
The group’s capital management strategy is focused on investing in the organic growth of the business and returning surplus funds to shareholders through dividends and share buy-backs:
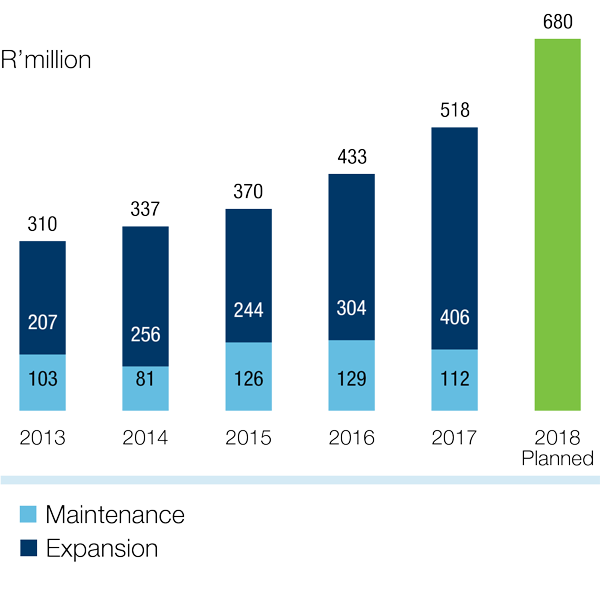
- Capital expenditure of R342 million was invested in opening 120 new retail stores and refurbishing 63 stores; R146 million in IT and retail infrastructure; and R30 million in UPD.
- The group returned R677 million to shareholders through dividend payments.
Capital expenditure
Cash flow analysis
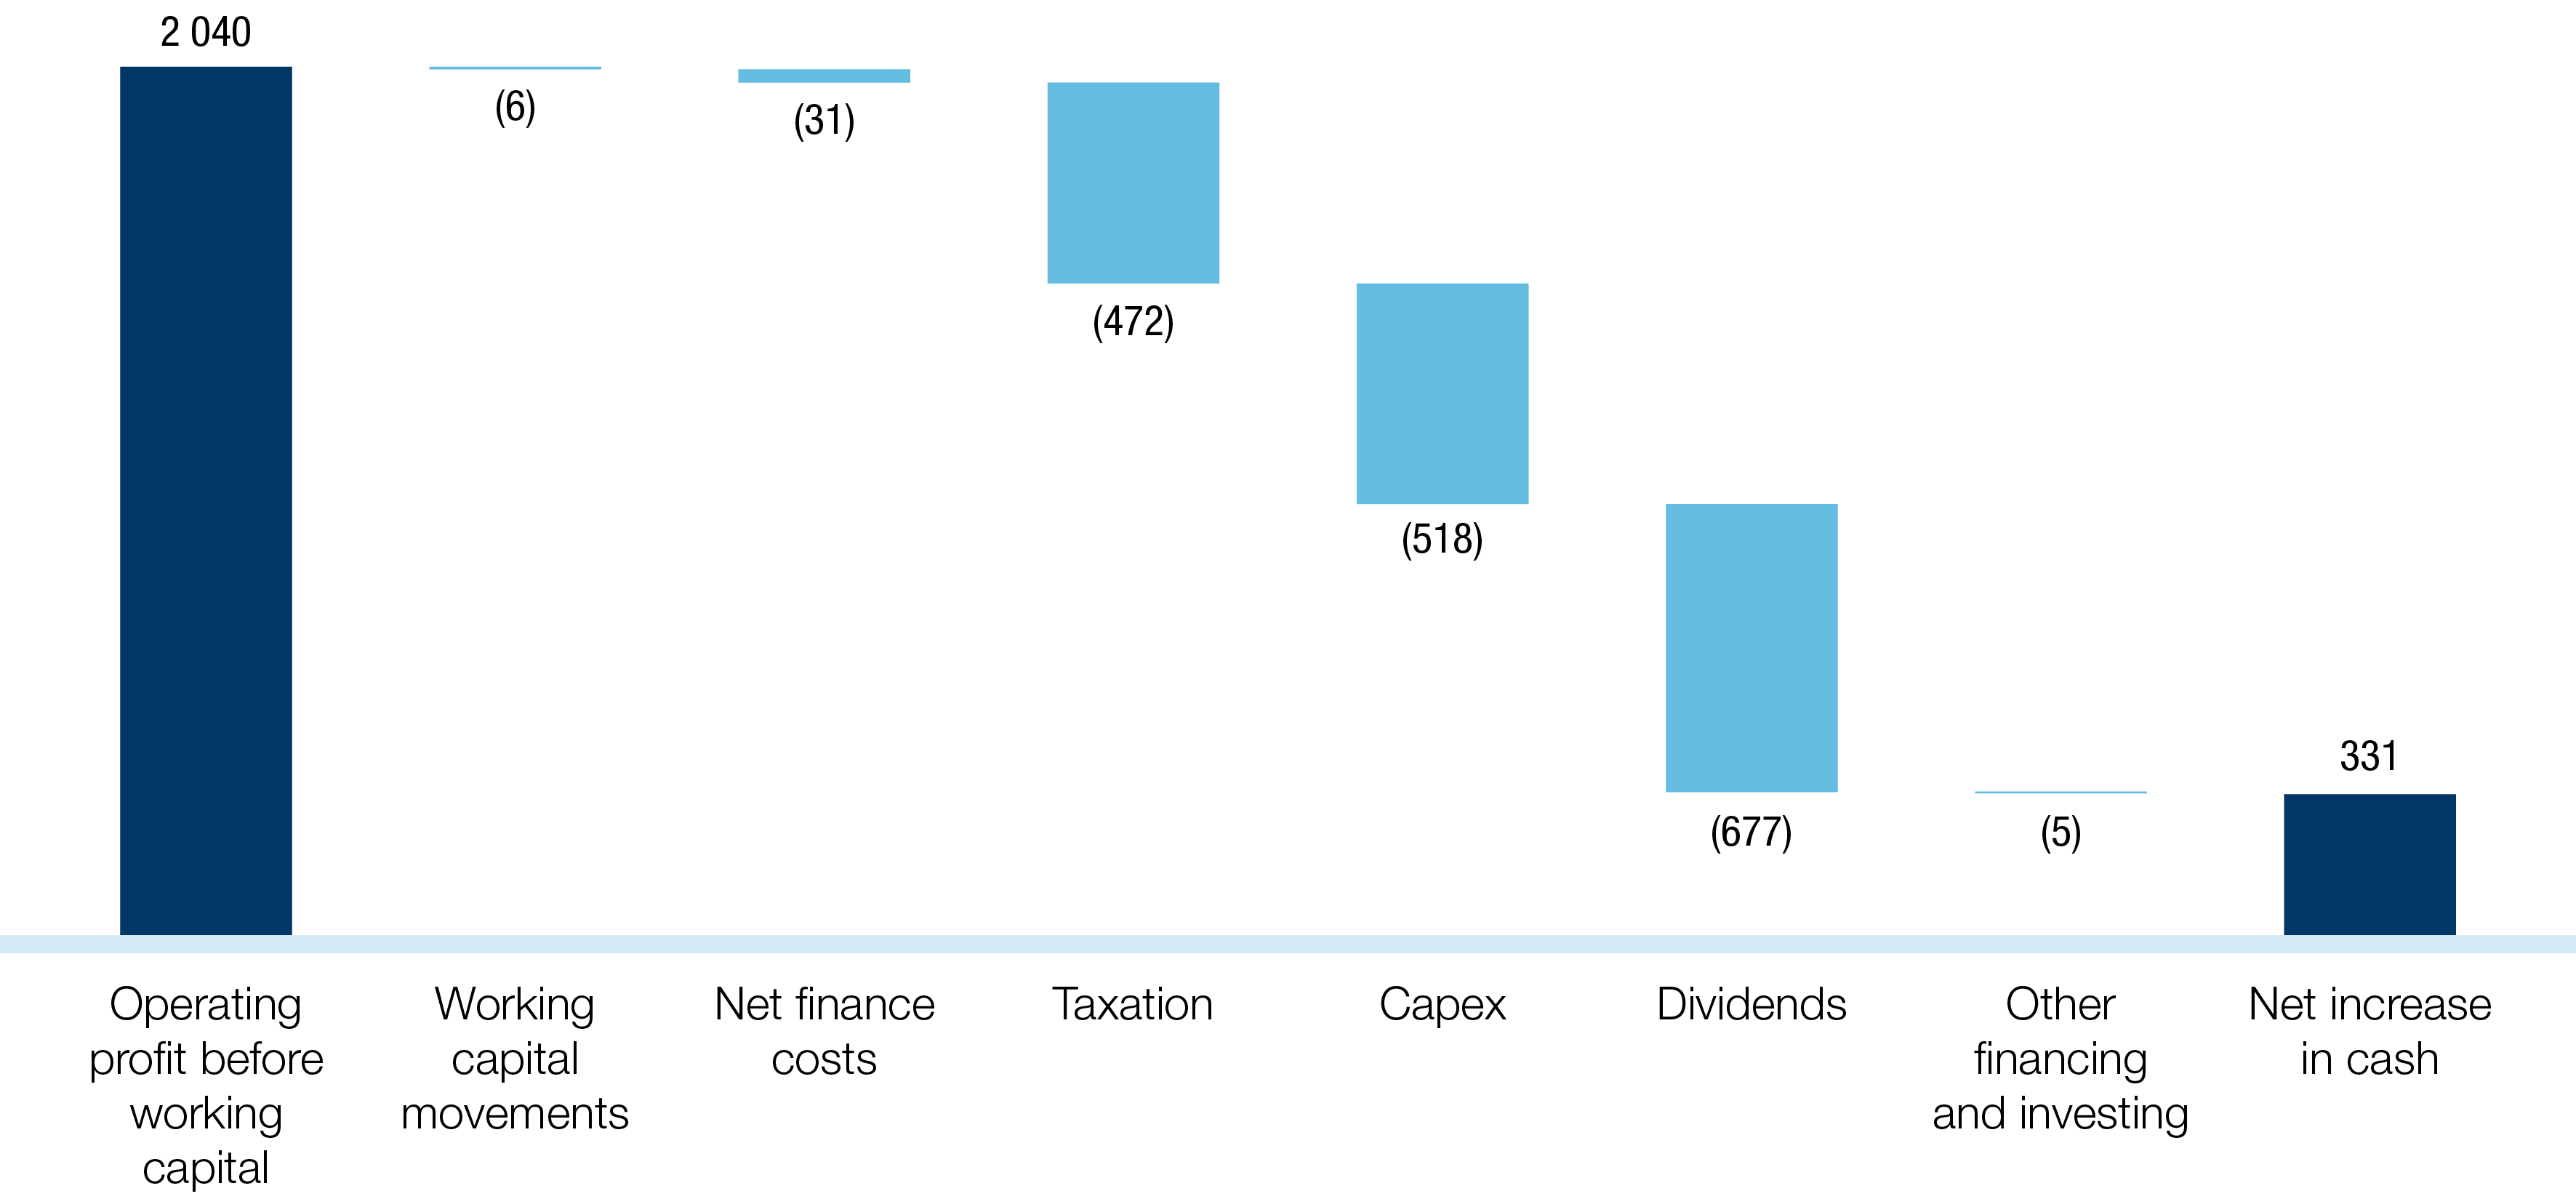
Dividends
The total dividend for the financial year was increased by 18.4% to 322 cents per share (2016: 272 cents), based on an increased dividend payout ratio of 60% (2016: 59%) of HEPS. This comprises the interim dividend of 88 cents (2016: 76 cents) and a final dividend of 234 cents (2016: 196 cents). A dividend of 32.2 cents per “A” share (2016: 27.2 cents) was declared for participants in the employee share ownership programme.
Information technology
Management aims to ensure IT systems and infrastructure are well maintained and remain relevant to future needs of the business.
Key areas of focus in the financial year included the seamless integration of the Netcare front shops and the Medicross pharmacies into the Clicks store network.
In the omni-channel space, the group enhanced the www.clicks.co.za transactional website with the development of the Clicks mobile app which offers customers the convenience of a virtual Clicks ClubCard as well as script management, pharmacy services and a store locator.
The group invested R83.6 million on computer hardware and R56.9 million in computer software which included replacing ageing IT hardware and software to improve processing capability and enhance capacity to support future business growth.
The IT governance team has remained vigilant against cybercrime and no Clicks data has been compromised, despite the increased incidence of data breaches globally. The group maintained its annual Payment Card Industry certification within the planned time frames and enhanced disaster recovery capability to limit potential disruption to the group should such an event occur.
Medium-term financial targets
Financial targets are disclosed to provide guidance to shareholders on the group’s medium-term performance expectations (refer to group strategy).
The targets have been reviewed based on current performance and the medium-term outlook for trading. The following targets have been revised while the dividend payout ratio has been included as a target for the first time:
| Performance metric |
Previous
target |
New
target |
| Group operating margin (%) |
6.0 – 7.0 |
6.5 – 7.5 |
| Operating margin: Distribution (%) |
2.0 – 2.5 |
2.2 – 2.7 |
| Dividend payout ratio (%) |
n/a |
60 – 65 |
The increased group operating margin target reflects management’s view on the growth potential for the retail health and beauty business and the impact of the faster growth in retail on the group margin. The increased operating margin target for UPD reflects the growth opportunities following the 30% expansion in distribution capacity as well as the increased scale of the business.
The targets for ROE, ROA, inventory days and retail operating margin are unchanged.
Financial plans for 2018
Capital expenditure of R680 million is planned for the 2018 financial year:
- R300 million to be invested in the store portfolio which includes 25 to 30 new Clicks stores, 30 to 35 new pharmacies and 60 store refurbishments.
- R306 million for IT systems and retail infrastructure which includes the 20 000 m² expansion of the Clicks distribution centre in Centurion, Gauteng. The project will be undertaken at a total cost of R230 million, with R110 million expected to be incurred in the 2018 financial year and the balance in the 2019 year.
- R74 million for warehousing, IT and infrastructure in UPD.
The group plans to spend between R650 million and R700 million per annum for the next three years to support the expansion of the Clicks store footprint, increasing capacity in the distribution centres and modernising IT systems.
Total retail trading space is expected to increase by approximately 6% in 2018.
The group remains committed to returning cash to shareholders which is surplus to the group’s operational and capital investment requirements through dividends and share buy-backs.
Appreciation
Thank you to our shareholders and funding institutions for their support and to the investment community both locally and offshore for the ongoing interest and engagement with the group. I also extend my thanks to the finance teams across the group for their commitment to constantly delivering a high standard of financial reporting.

Michael Fleming
Chief financial officer
 Downloads
 Shareholder Information