Some things in life is just better viewed on a big screen Please open this report on a tablet in landscape mode or bigger screen.
Some things in life is just better viewed on a big screen Please open this report on a tablet in landscape mode or bigger screen.

Michael Fleming, Chief financial officer
Clicks Group continued to deliver highly competitive returns to shareholders against the backdrop of a deteriorating economic environment, with the business generating strong organic revenue growth and cash flows while investing record levels of capital to fund longer-term growth.
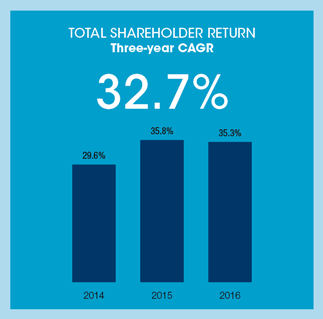
Diluted headline earnings per share (HEPS) grew by 14.2% to 438.5 cents and the total dividend was increased by 15.7% to 272.0 cents per share. The group delivered a total shareholder return of 35.3%, based on the dividend payout and the growth in the share price over the year. Over the past three years the group has delivered a compound annual growth rate in total shareholder return of 32.7% per annum.
The group has paid cash distributions of R3.2 billion to shareholders since 2006, with the total cash returned to shareholders amounting to R6.7 billion over the past 10 years.
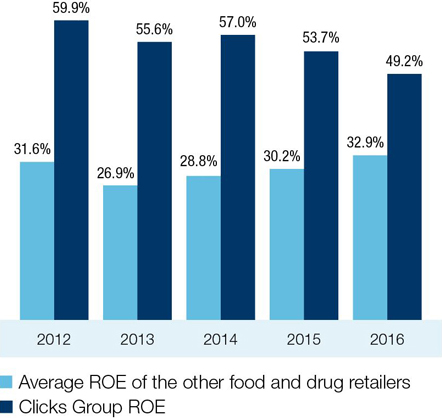
The group’s medium-term financial targets rank in the upper quartile relative to comparable global health and beauty retailers such as Walgreens (USA), CVS (USA), Raia Drogasil (Brazil), Rite Aid (USA) and Celesio (Germany). The retail, distribution and group operating margin targets were achieved in 2016 while the group is marginally below the medium-term targeted ranges on inventory management, return on assets (ROA) and return on equity (ROE), which remains among the highest in the retail sector at 49.2%.
The review of the group’s financial performance for the year ended 31 August 2016 focuses on the key line items of the statements of comprehensive income and financial position which management considers material to the group’s performance.
The following review should be considered together with the annual financial statements available on the website, the summary statements of comprehensive income and financial position below and the five-year analysis of financial performance.
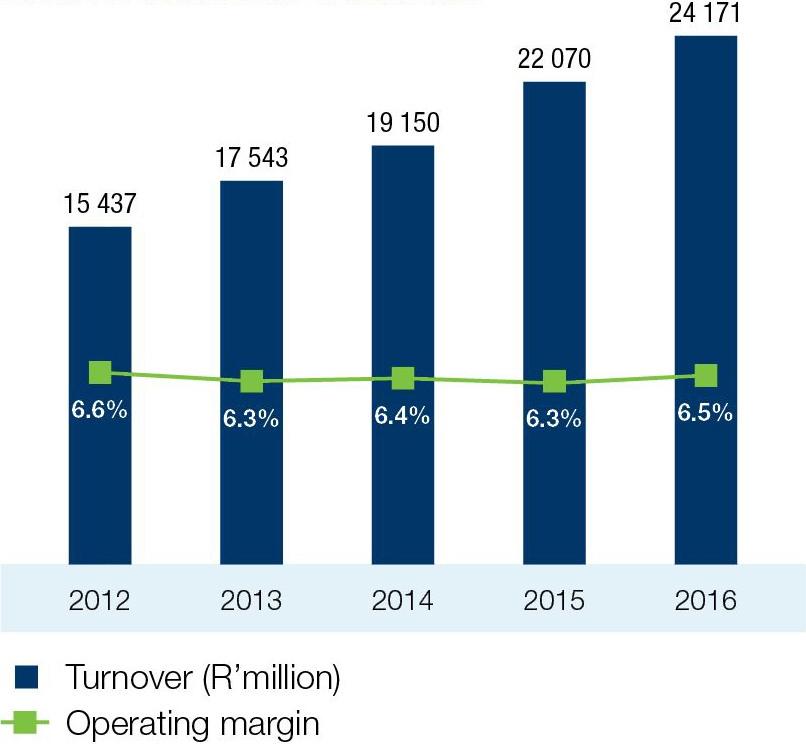
Group turnover increased by 9.5% to R24.2 billion (2015: R22.1 billion), with selling price inflation being contained to 4.9% for the year.
Turnover was consistent for both halves. There is generally minimal seasonal effect on the group’s turnover as the festive season in the first half of the financial year is counter-balanced by the winter season, which is the peak trading period for the healthcare business.
Retail turnover, including Clicks, The Body Shop, GNC, Claire’s and Musica, increased by 12.8%. Retail selling price inflation averaged 4.3% for the year. Comparable store sales growth of 9.8% was driven by strong promotional activity which resulted in real volume growth of 5.5%. The opening of a net 32 retail stores, including 25 Clicks outlets, accounted for 3% of retail turnover growth.
Distribution turnover grew by 6.1%, impacted by the lower regulated single exit price (SEP) increase of 4.8% in 2016 compared to 7.5% in 2015, the ongoing genericisation of medicines and the slower growth of the pharmaceutical market.
The trading performance of Clicks and UPD is covered in the Clicks operational review and the UPD operational review.
The investment in everyday competitive pricing, supported by effective promotional activity, contributed to the retail total income margin declining by 30 basis points to 33.7%.
UPD maintained its total income margin at 7.8%.
Owing to the faster growth in the retail business the group’s total income margin improved by 30 basis points to 26.3%, with total income increasing by 11.0% to R6.4 billion.
The group’s operating expenses increased by 10.5%.
Retail operating expenditure as a percentage of turnover improved to 25.8% from 26.2%. Expense growth of 11.2% reflects the investment in new stores, the addition of 39 pharmacies and the focus on enhancing customer service in stores. The 13.1% increase in employment costs includes the charge for the broad-based employee share ownership scheme which increased to R65 million (2015: R52 million) for the year. Comparable retail cost growth was contained at 6.4%.
UPD demonstrated excellent cost control in a difficult market and restricted expense growth to 7.4%. Expenses for the second half grew by only 2.5% after the business invested in once-off security upgrades in the first half.
Operating profit increased by 12.6% to R1.6 billion (2015: R1.4 billion) as both retail and distribution businesses maintained margin in the challenging trading conditions. The stronger growth of the retail business, which accounts for 83% of group profit, resulted in the group margin expanding by 20 basis points to 6.5%.
The ratio of shareholders’ interest to total assets was 29.3% (2015: 26.6%) and the average gearing level during the year was 23.9%.
The ratio of current assets to current liabilities at year-end was consistent at 1.1 times (2015: 1.1 times), indicating that working capital remains adequately funded.
The group continues to hedge direct exposures to foreign exchange rate fluctuations which impact between 8% and 9% of the cost of sales in the retail business. This ongoing hedging strategy was particularly effective during the first nine months of the financial year given the significant devaluation of the rand against all major currencies during 2016. The ongoing volatility of the rand continues to be challenging to forecast. In addition, the group hedged elements of the long-term incentive scheme for the 2016 – 2018 period. Further detail on the respective hedges and risk management is contained in note 16 in the annual financial statements.
Group inventory days improved from 68 to 66 days which was outside the medium-term targeted range of 55 to 60 days. Overall group inventories were 7% higher than the prior year.
Retail inventory levels were 15.5% higher at year-end as the business focused on maximising availability, particularly in the current constrained environment where spending peaks sharply over month-ends. Clicks has also increased its inventory holding of higher-margin private label and exclusive branded product. UPD stock levels normalised at 40 days, down five days from the prior year.
Trade receivables continued to be well controlled at 43 days, relating primarily to the UPD business.
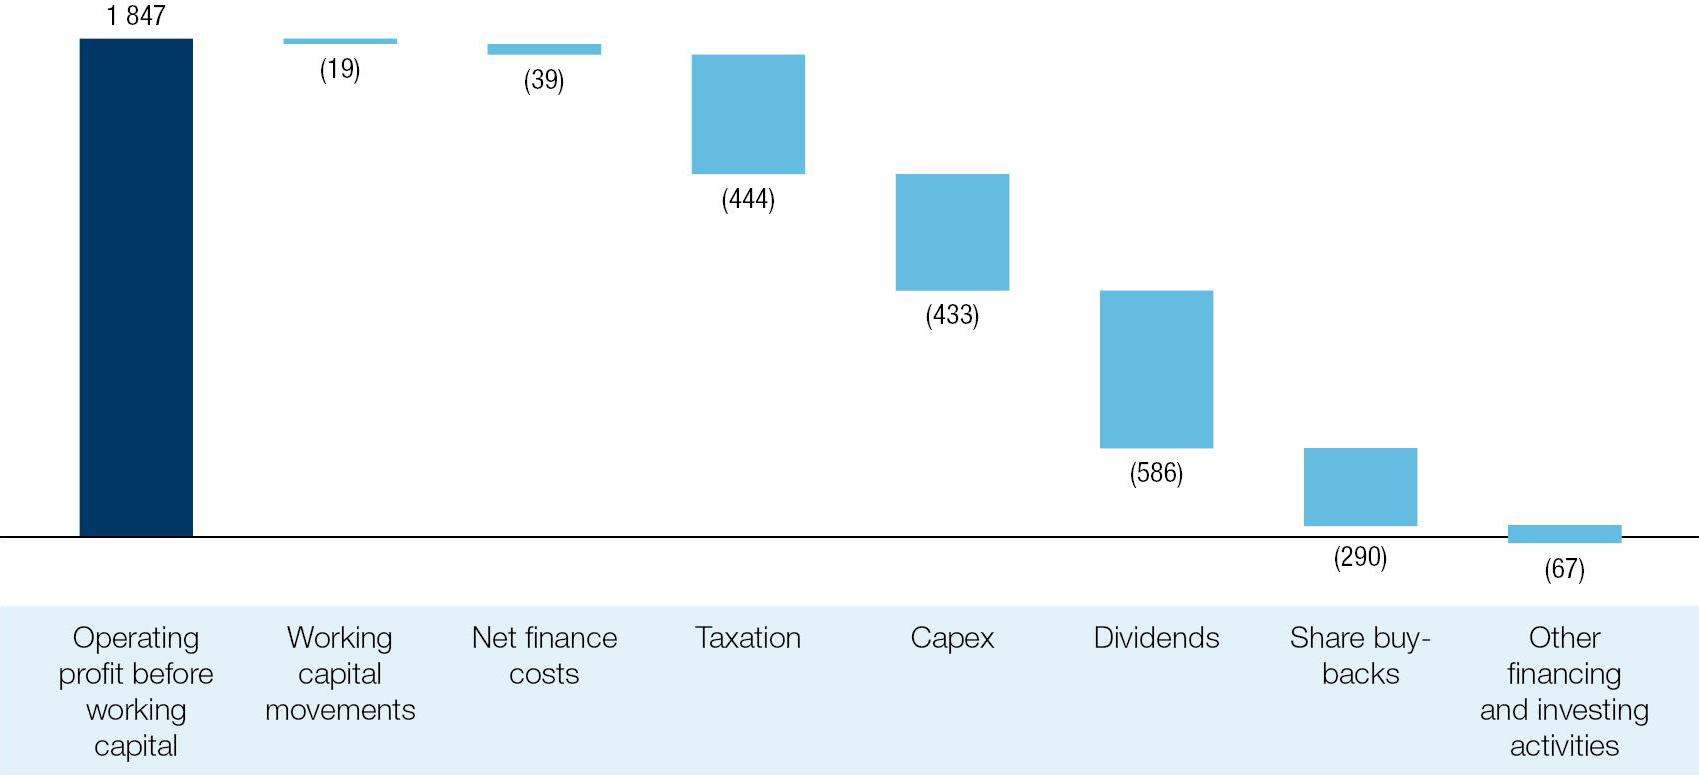
Cash inflow from operations before working capital changes increased by R147 million to R1.85 billion. Working capital was well managed during the year resulting in a net cash outflow of R19.5 million for the year.
The group’s capital management strategy is focused on investing in the organic growth of the business and returning surplus funds to shareholders through dividends and share buy-backs:
Over the past ten years the group has acquired R3.5 billion in shares at an average price of R23.86.
The total dividend for the financial year was increased by 15.7% to 272 cents per share (2015: 235 cents), based on the dividend payout ratio of 59% of HEPS. This comprises the interim dividend of 76 cents (2015: 65.5 cents) and a final dividend of 196 cents (2015: 169.5 cents). A dividend of 27.2 cents per “A” share (2015: 23.5 cents) was declared for participants in the employee share ownership programme.
Financial targets provide guidance to shareholders on the group’s medium-term performance expectations. The medium-term targets for 2017 to 2019 have been reviewed based on the performance for 2016 and the outlook for the next three years.
The board and management have reviewed and revised the following targets:
| Performance metric | Revised target | Previous target |
|---|---|---|
| Operating margin: Retail (%) | 7.5 – 8.5 | 7.0 – 8.0 |
| Inventory days | 60 – 65 | 55 – 60 |
The change in the retail operating margin and inventory days targets reflect the growing portfolio of private label and exclusive brands which will enhance margin but require investment in inventory to support growth.
The targets for ROE, ROA and operating margin (group and distribution) are unchanged.
Capital expenditure of R577 million is planned for the 2017 financial year:
Total retail trading space is expected to increase by approximately 5%.
The group remains committed to returning cash to shareholders which is surplus to the group’s operational and capital investment requirements through dividends and share buy-backs.
Thank you to our shareholders both locally and internationally as well as the broader investment community for their ongoing interest and engagement with the group. My thanks are also due to the dedicated finance staff across the group for their support in constantly striving to achieve best reporting standards.

| R’million | 2016 | % of turnover | 2015 | % of turnover | % change |
|---|---|---|---|---|---|
| Turnover | 24 171 | 22 070 | 9.5 | ||
| Retail | 16 640 | 68.8 | 14 758 | 66.9 | 12.8 |
| Distribution | 11 055 | 31.2 | 10 415 | 33.1 | 6.1 |
| Intragroup | (3 524) | (3 103) | 13.6 | ||
| Total income | 6 368 | 26.3 | 5 735 | 26.0 | 11.0 |
| Operating expenses | (4 796) | 19.8 | (4 339) | 19.7 | 10.5 |
| Retail | (4 298) | (3 867) | 11.2 | ||
| Distribution | (591) | (550) | 7.4 | ||
| Intragroup | 93 | 78 | |||
| Operating profit | 1 572 | 6.5 | 1 396 | 6.3 | 12.6 |
| Retail | 1 306 | 7.8 | 1 151 | 7.8 | 13.5 |
| Distribution | 276 | 2.5 | 258 | 2.5 | 6.7 |
| Intragroup | (10) | (13) | |||
| Loss on disposal of property, plant and equipment | (6) | (9) | |||
| Net financing costs | (53) | (57) | (7.8) | ||
| Share of profit of an associate | 2 | – | |||
| Income tax | (421) | (375) | 12.3 | ||
| Profit for the year | 1 094 | 955 | 14.6 |
| R’million | 2016 | 2015 | % change |
|---|---|---|---|
| Non-current assets | 2 507 | 2 009 | 24.8 |
| Property, plant and equipment | 1 345 | 1 222 | 10.1 |
| Other non-current assets | 1 162 | 787 | 47.6 |
| Current assets | 5 870 | 5 547 | 5.8 |
| Inventories | 3 479 | 3 250 | 7.0 |
| Trade and other receivables | 2 013 | 1 871 | 7.6 |
| Other current assets | 378 | 426 | (11.0) |
| Total assets | 8 377 | 7 556 | 10.9 |
| Equity | 2 452 | 2 013 | 21.8 |
| Non-current liabilities | 406 | 308 | 31.5 |
| Current liabilities | 5 519 | 5 235 | 5.4 |
| Trade and other payables | 5 148 | 4 898 | 5.1 |
| Other current liabilities | 371 | 337 | 10.2 |
| Total equity and liabilities | 8 377 | 7 556 | 10.9 |


