


Chief Financial Officer's Report
“The business remained strongly cash generative over the past year while investing record levels of capital expenditure and returning substantial funds to shareholders.”
Michael Fleming, Chief financial officer
Introduction
Clicks Group continued to pursue its organic growth strategy supported by sound capital management which delivered highly competitive returns to shareholders. The business remained strongly cash generative over the past year while investing record levels of capital expenditure and returning substantial funds to shareholders.
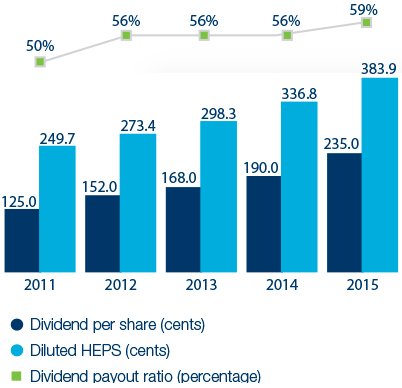
Diluted headline earnings per share (HEPS) grew by 14.0% to 383.9 cents and the total dividend was increased by 23.7% to 235 cents per share, based on an increased dividend payout ratio of 59% (2014: 56%). The dividend together with the growth in the share price represents a total shareholder return of 35.8% for the year.
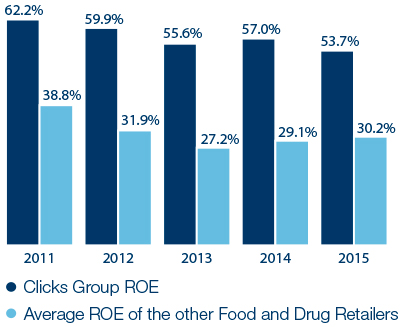
The group also performed well relative to its medium-term financial targets, achieving four of the five indicators, and only being outside of the targeted range on inventory management. The return on equity (ROE) at 53.7% is the highest in the retail sector. These financial targets benchmark favourably against global health and beauty retailers.
Sustained financial performance
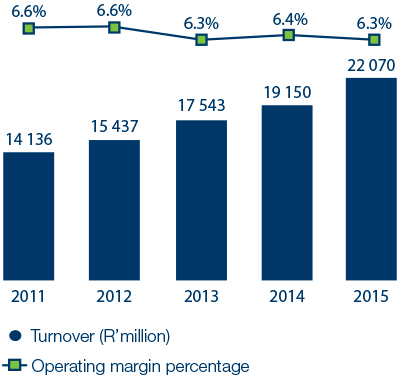
Turnover and margin
Return on equity
Financial performance
The review of the group’s financial performance for the year ended 31 August 2015 focuses on the key line items of the statements of comprehensive income and financial position which management consider material to the group’s performance. The review should be read in conjunction with the annual financial statements on the group’s website and the five-year analysis of financial performance.
Summary statement of comprehensive income
|
R'million |
2015 |
2014 |
% change |
|
Turnover |
22 070 |
19 149 |
15.3 |
|
Total income |
5 735 |
5 172 |
10.9 |
|
Operating expenses |
4 339 |
3 954 |
9.7 |
|
Operating profit |
1 396 |
1 218 |
14.6 |
|
Profit for the year |
955 |
865 |
10.4 |
Turnover
Group turnover increased by 15.3% to R22.1 billion (2014: R19.1 billion), with selling price inflation being contained to 4.0% for the year.
Turnover in the second half accounted for 51.7% (2014: 51.2%) of total turnover. There is generally minimal seasonal effect on the group’s turnover as the festive season in the first half of the financial year is counter-balanced by the winter season, which is the peak trading period for the healthcare business.
Retail turnover, covering Clicks (including GNC and Claire’s), The Body Shop and Musica, increased by 10.4%, with comparable store growth of 7.5%. Retail selling price inflation averaged 4.0% for the year.
The Clicks chain increased sales by 10.9% and by 7.9% in comparable stores. This was driven by real volume growth of 3.6% through effective promotions and price competitiveness. A net 22 Clicks stores were opened during the year which accounted for 3% of the chain’s turnover growth.
The Body Shop increased turnover by 12.7% and by 9.4% in same store sales. Musica grew sales by 2.3% as the brand gained share in the shrinking entertainment retail market.
UPD benefited from the growth in its preferred supply chain partner distribution contracts and increased turnover by 21.6%.
The trading performance of Clicks and UPD is covered in the operational review.
Total income
Total income, comprising gross profit and other income, increased by 10.9% to R5.7 billion. The faster turnover growth in UPD has resulted in the group’s total income margin reducing by 100 basis points to 26.0%.
The retail total income margin improved by 20 basis points to 34.0%, benefiting from private label margin growth in Clicks and well managed promotional campaigns.
UPD’s total income increased by 11.0%. However, the margin was impacted by the shift in business mix with the faster growth of the distribution contracts which are reflected in turnover. This contributed to the margin declining by 70 basis points to 7.8%.
Operating expenditure
Operating expenses increased by 9.7% as the group continued to focus on tight cost control.
Retail expenses were 10.1% higher primarily due to the increased investment in stores, staff and marketing costs. Employment costs, which increased by 11.2%, were well controlled. Pharmacy professional costs rose 11.8% and the pharmacy staff turnover ratio reduced from 24% to 22%. The charge for the broad-based employee share ownership scheme increased to R52 million (2014: R31 million) owing to the higher share price over the period. Comparable retail cost growth was contained at 8.0%.
UPD expense growth of 8.4% was well below turnover growth of 21.6% for the year. The increase was mainly attributable to the higher variable costs from the growth in the distribution business. Comparable costs increased by 6.1%.
Operating profit
Operating profit increased by 14.6% to R1.4 billion (2014: R1.2 billion). The retail business, which accounts for 82% of group profit, improved its operating margin by 30 basis points to 7.8%. UPD increased operating profit by 17.0% although the increase in the lower-margin generics business continues to place pressure on the margin which reduced by 10 basis points to 2.5%. All the margins are within the group’s medium-term target ranges.
Summary statement of financial position
|
R'million |
2015 |
2014 |
% change |
|
Non-current assets |
2 009 |
1 772 |
13.4 |
|
Current assets |
5 547 |
4 420 |
25.5 |
|
Total assets |
7 556 |
6 192 |
22.0 |
|
Total equity |
2 013 |
1 567 |
28.5 |
|
Non-current liabilities |
308 |
286 |
7.7 |
|
Current liabilities |
5 235 |
4 339 |
20.6 |
|
Total equity and liabilities |
7 556 |
6 192 |
22.0 |
The ratio of shareholders’ interest to total assets was 26.6% (2014: 25.3%) and the average gearing level during the year was 33%.
The ratio of current assets to current liabilities at year-end was consistent at 1.1 times (2014: 1.0 times) and indicates that working capital remains adequately funded.
The group continues to hedge direct exposures to foreign exchange rate fluctuations which impact between 7% to 8% of the cost of sales in the retail business. In addition, the group hedged elements of the long-term incentive scheme for the 2016 – 2018 period. Further detail on the respective hedges is contained in note 15 in the annual financial statements on the group’s website.
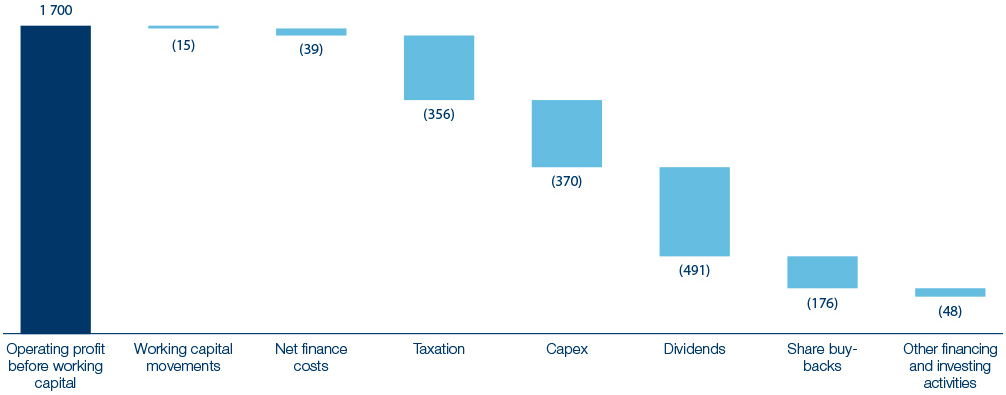
Cash flow analysis
R'million
Inventory
Group inventory days increased from 64 to 68 days which was outside the medium-term targeted range of 55 to 60 days.
Inventory levels were 24.3% higher at year-end. This can be attributed to the group focusing on improving product availability in the retail brands, with Clicks achieving record average availability of 97.5%, and also buying stock for the expansion of the retail franchise brands in Clicks stores. UPD stock levels were higher than expected and have normalised subsequent to the year-end.
Cash and capital management
Cash inflow from operations before working capital changes increased by R209 million to R1.7 billion.
The group’s capital management strategy is focused on investing in the organic growth of the business and returning surplus funds to shareholders through dividends and share buy-backs:
- a record R370 million was invested in capital expenditure, this included R216 million on opening 41 new retail stores and refurbishing 43 stores; R100 million in IT infrastructure, systems and software; and R28 million in UPD for warehousing and infrastructure; and
- the group returned R667 million to shareholders through dividend payments of R491 million and share buy-backs of R176 million.
Since the inception of the share buy-back programme in May 2006, the group has acquired R3.1 billion in shares at an average price of R22.40, representing 41.2% of the issued shares at the start of the programme.
Dividends
The total dividend for the financial year was increased by 23.7% to 235 cents per share (2014: 190 cents), based on a reduced dividend cover of 1.7 times HEPS (2014: 1.8 times). This comprises the interim dividend of 65.5 cents (2014: 53.5 cents) and a final dividend of 169.5 cents (2014: 136.5 cents). A dividend of 23.5 cents per “A” share (2014: 19 cents) was declared for participants in the employee share ownership programme.
Targets and plans for 2016
The group’s medium-term financial targets have been reviewed based on the performance for 2015 and the outlook for the next three years, and are unchanged for 2016 to 2018.
Capital expenditure of R432 million is planned for the 2016 financial year:
- R227 million for 33 new stores across all retail brands, 25 to 35 new pharmacies, and 60 store refurbishments;
- R167 million for retail infrastructure to drive operational efficiencies; and
- R38 million for UPD which will include the completion of the warehouse facility in Port Elizabeth.
Total trading space is expected to increase by approximately 5%.
The group remains committed to returning cash to shareholders which is surplus to the group’s operational and investment requirements through dividends and share buy-backs.
Appreciation
Thank you to our shareholders and the broader investment community both locally and internationally for their continued investment and interest in the group. I also thank the finance staff across the group for their dedication and commitment to achieving best practice reporting standards.

Michael Fleming
Chief financial officer

